Project name: project-gigas_ploidy
Funding source: unknown
Species: Crassostrea gigas
variable: ploidy, desiccation, high temperature
Background
After comparing analyses and looking at genome feature locations, we decided to continue using the Ronit dataset with Yaamini controls to see what the processes look like.
GOterm annotation
GOterm annotation was carried out using this jupyter-notebook
The key outputs I got from this notebook are:
- A master annotation table (cgigas_uk_roslin_v1_rna_from_genomic_annot.transcript.tab).
- A summary (union, 1x coverage) of the CpG background generated form the .bed files, joined with transcript IDs and GO annotations (union_1x.GeneIDs.geneOverlap.transcriptIDs.GOAnnot).
- A gene ID to GO term map that compares the unique transcript IDs within the background and the blast annotation (geneid2go.tab)
- A summary object of the DML associated with the test factor, joined with transcript IDs and GO annotations (e.g., DML-Cov10-20.GeneIDs.geneOverlap.transcriptIDs.GOAnnot)
I created a unique notebook for each dataset. Ronit’s data had a lot of GO terms, and required at least 48 GB of ram to complete the analysis.
Results
Here is the prior table for reference:
Table 1. DML counts from each analysis
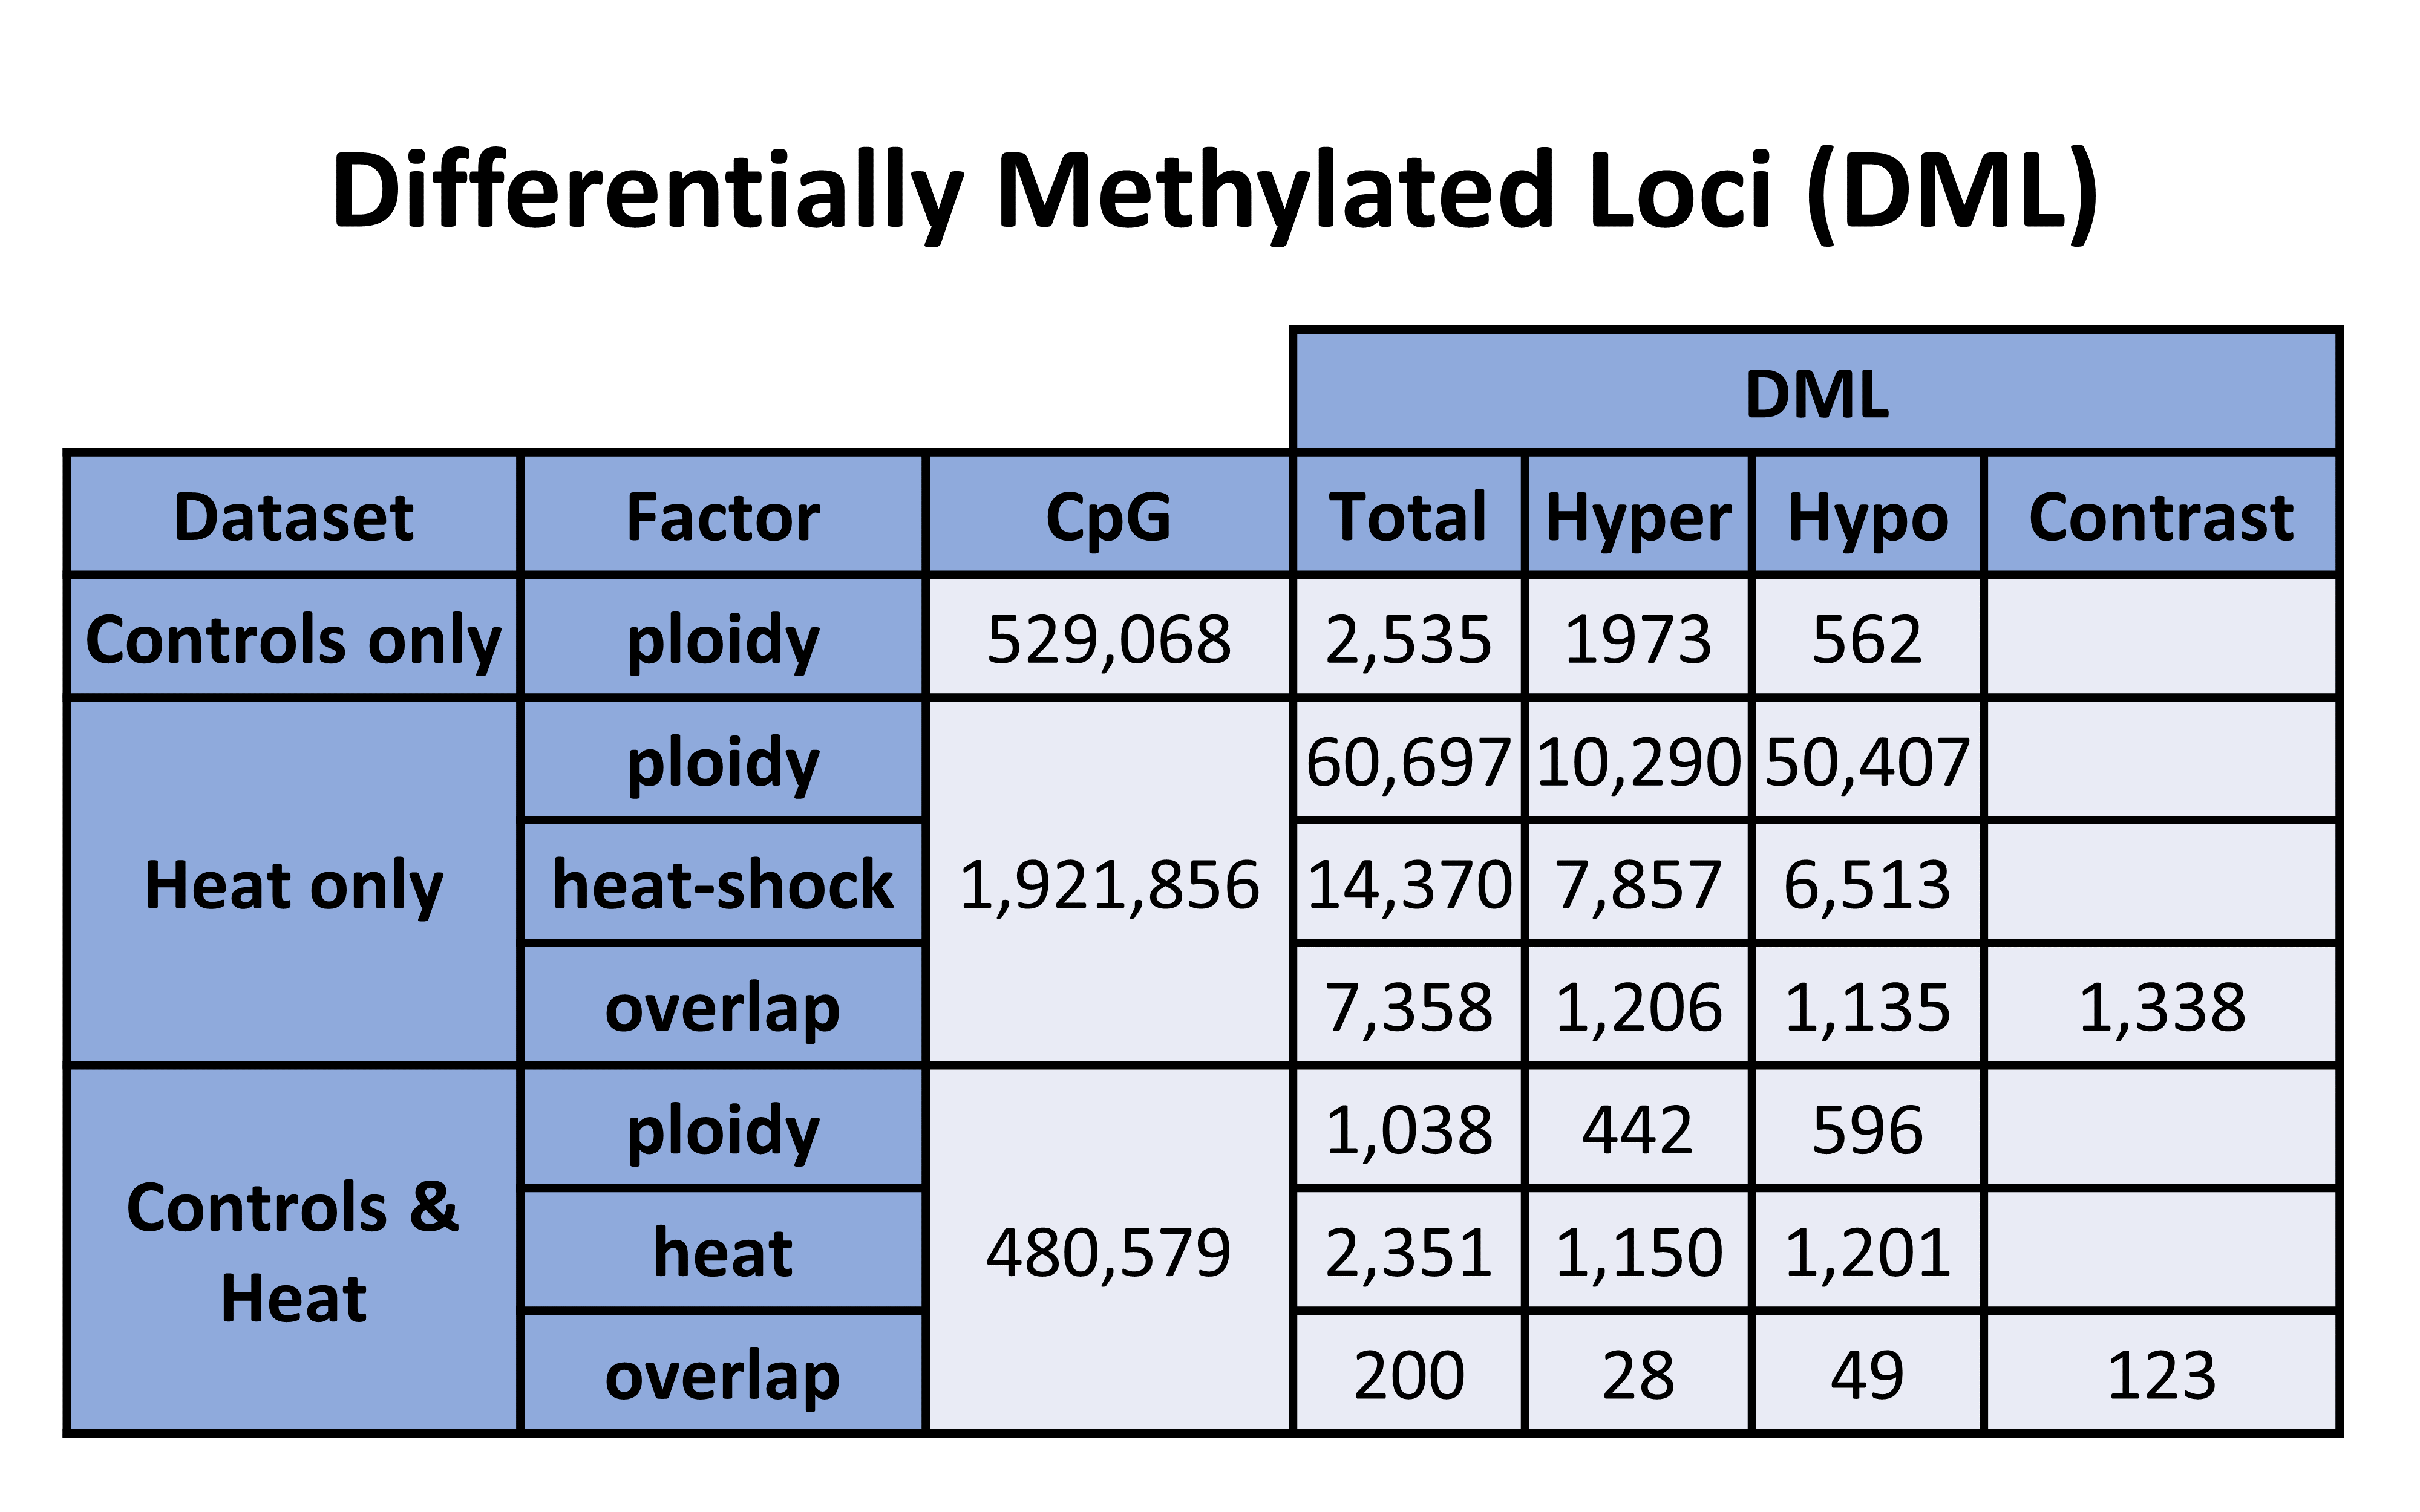
Figure 1. GO terms (counts + percentages). BP = biological processes, CC = cellular components, MF = molecular functions.
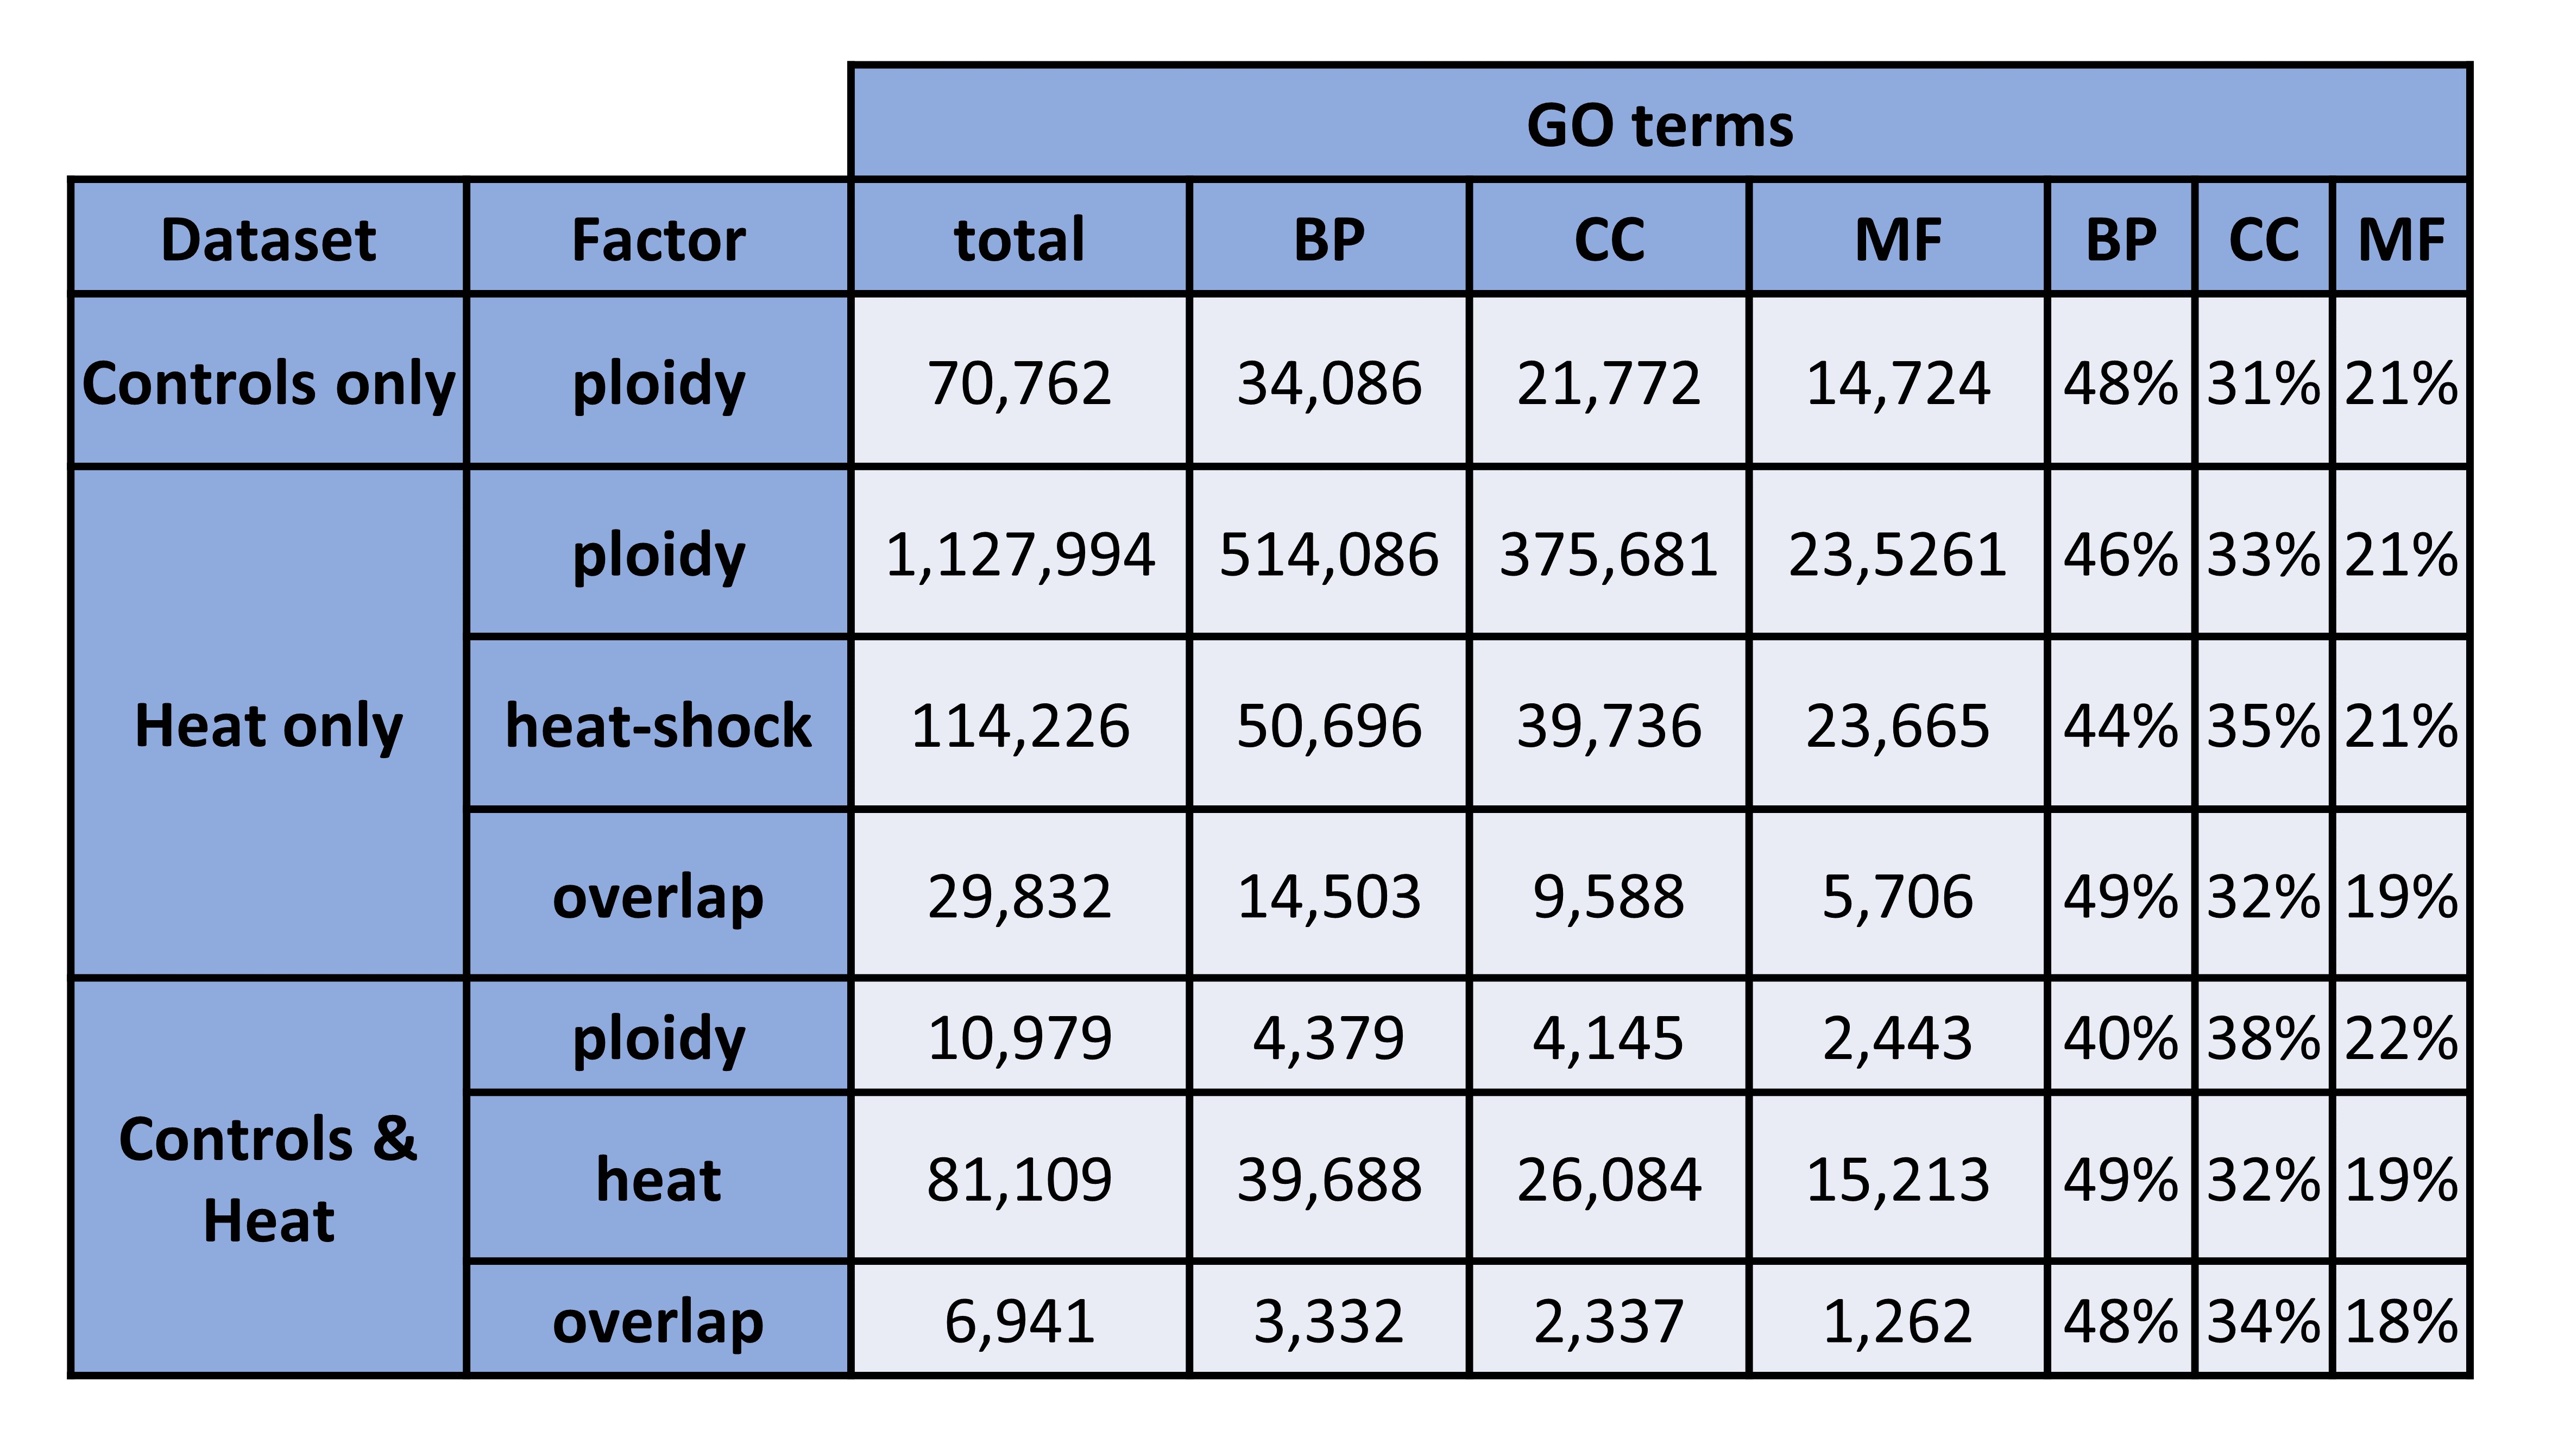
Figure 2. Unique transcripts, genes, and gene products (counts). BP = biological processes, CC = cellular components, MF = molecular functions.
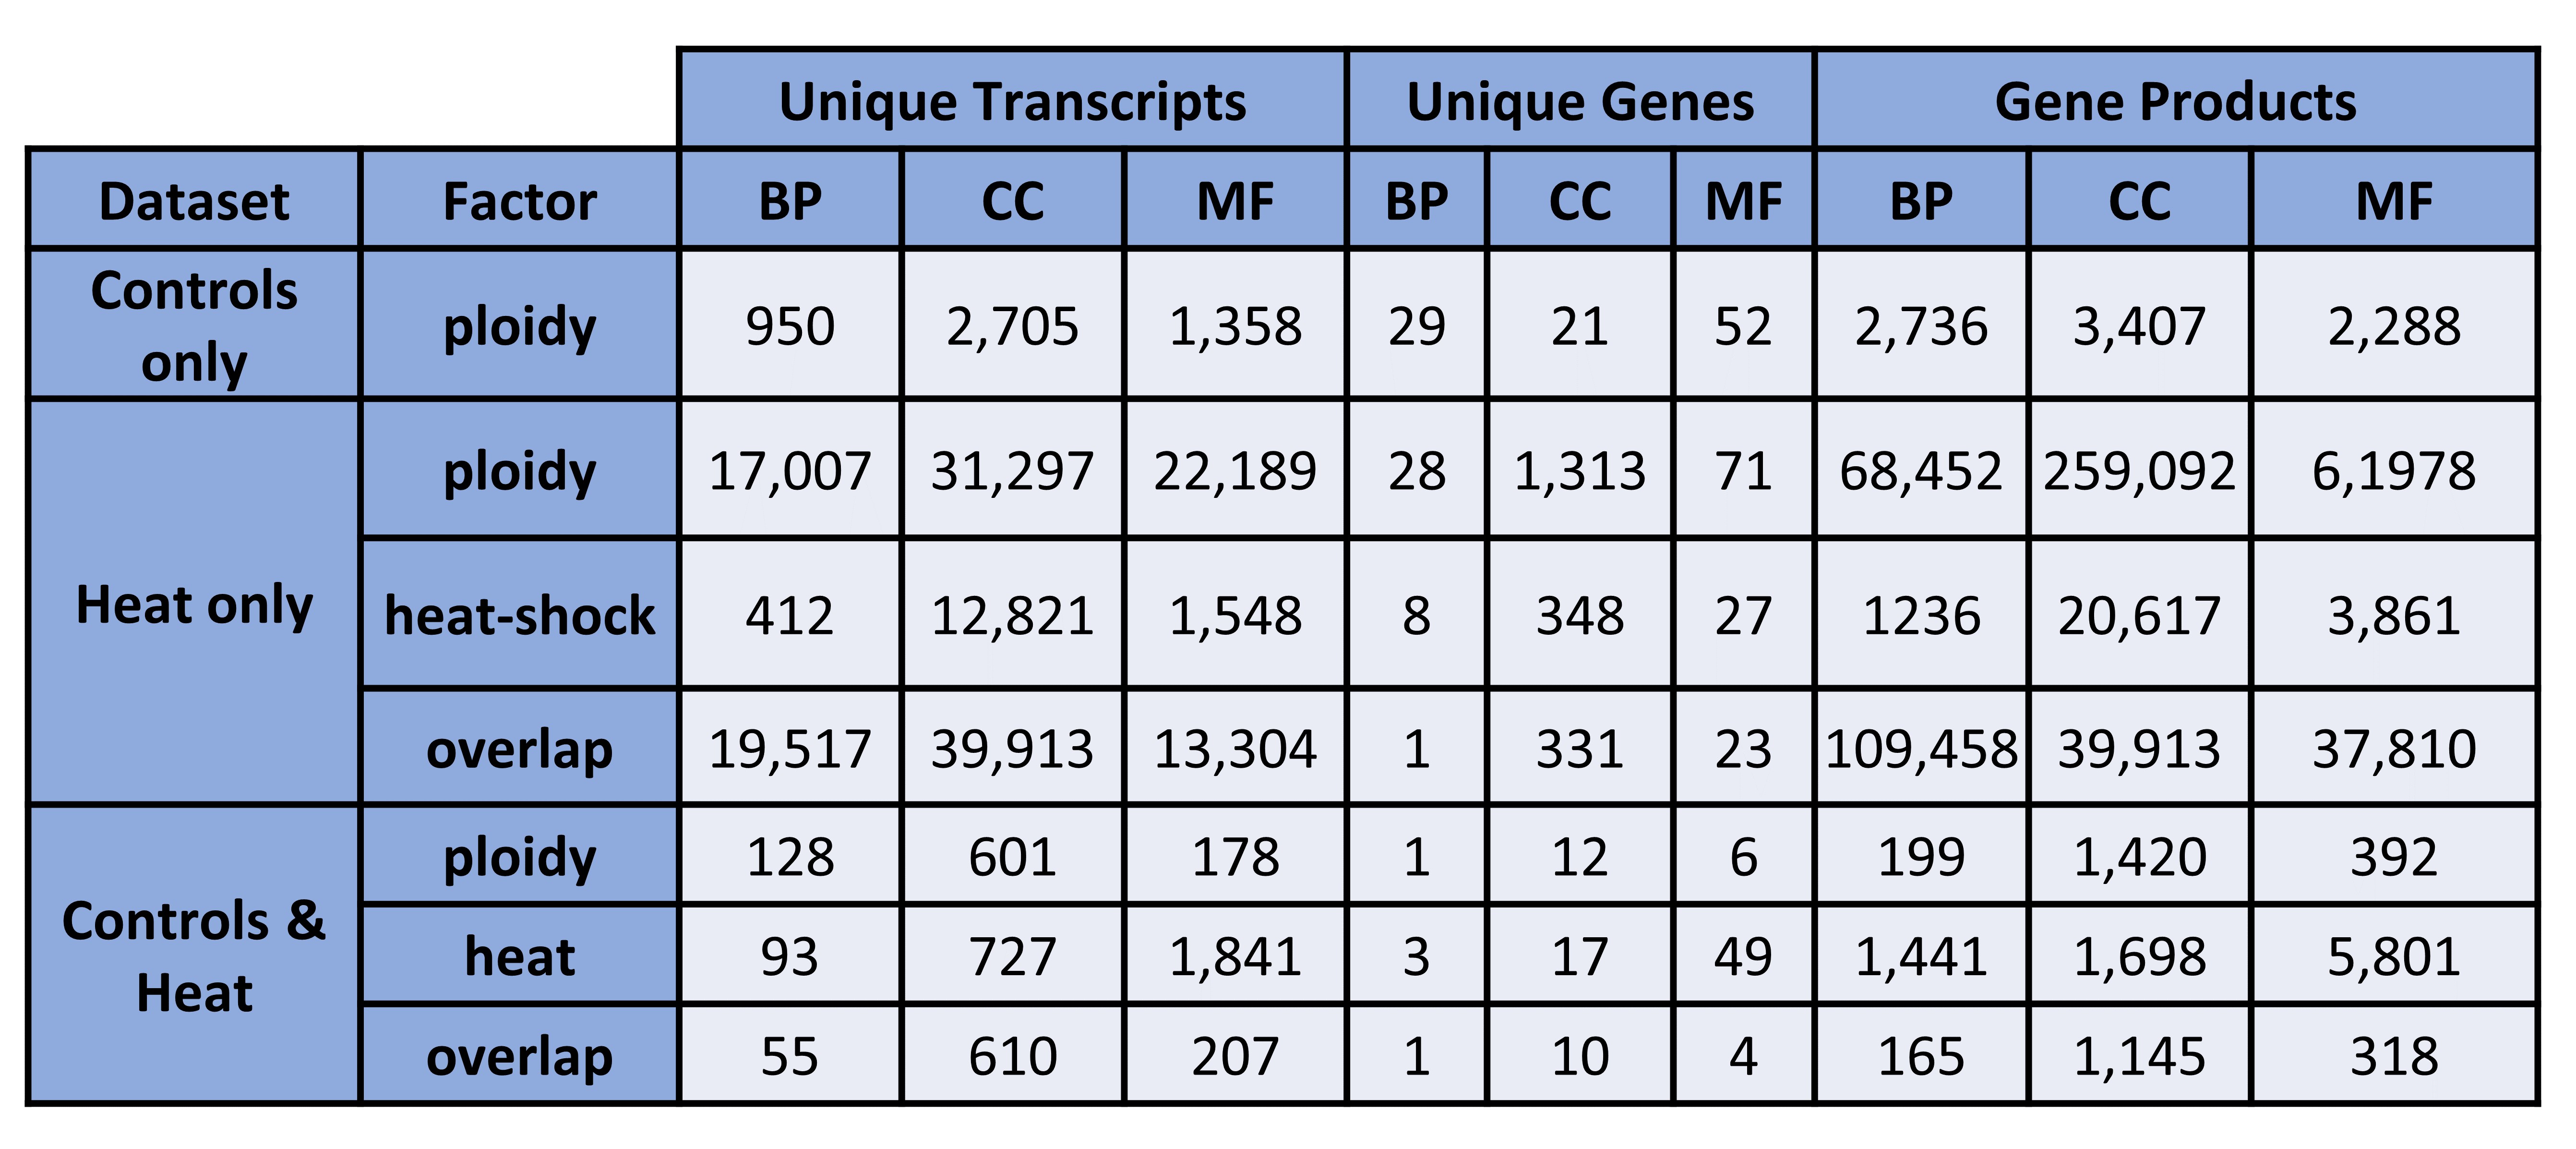
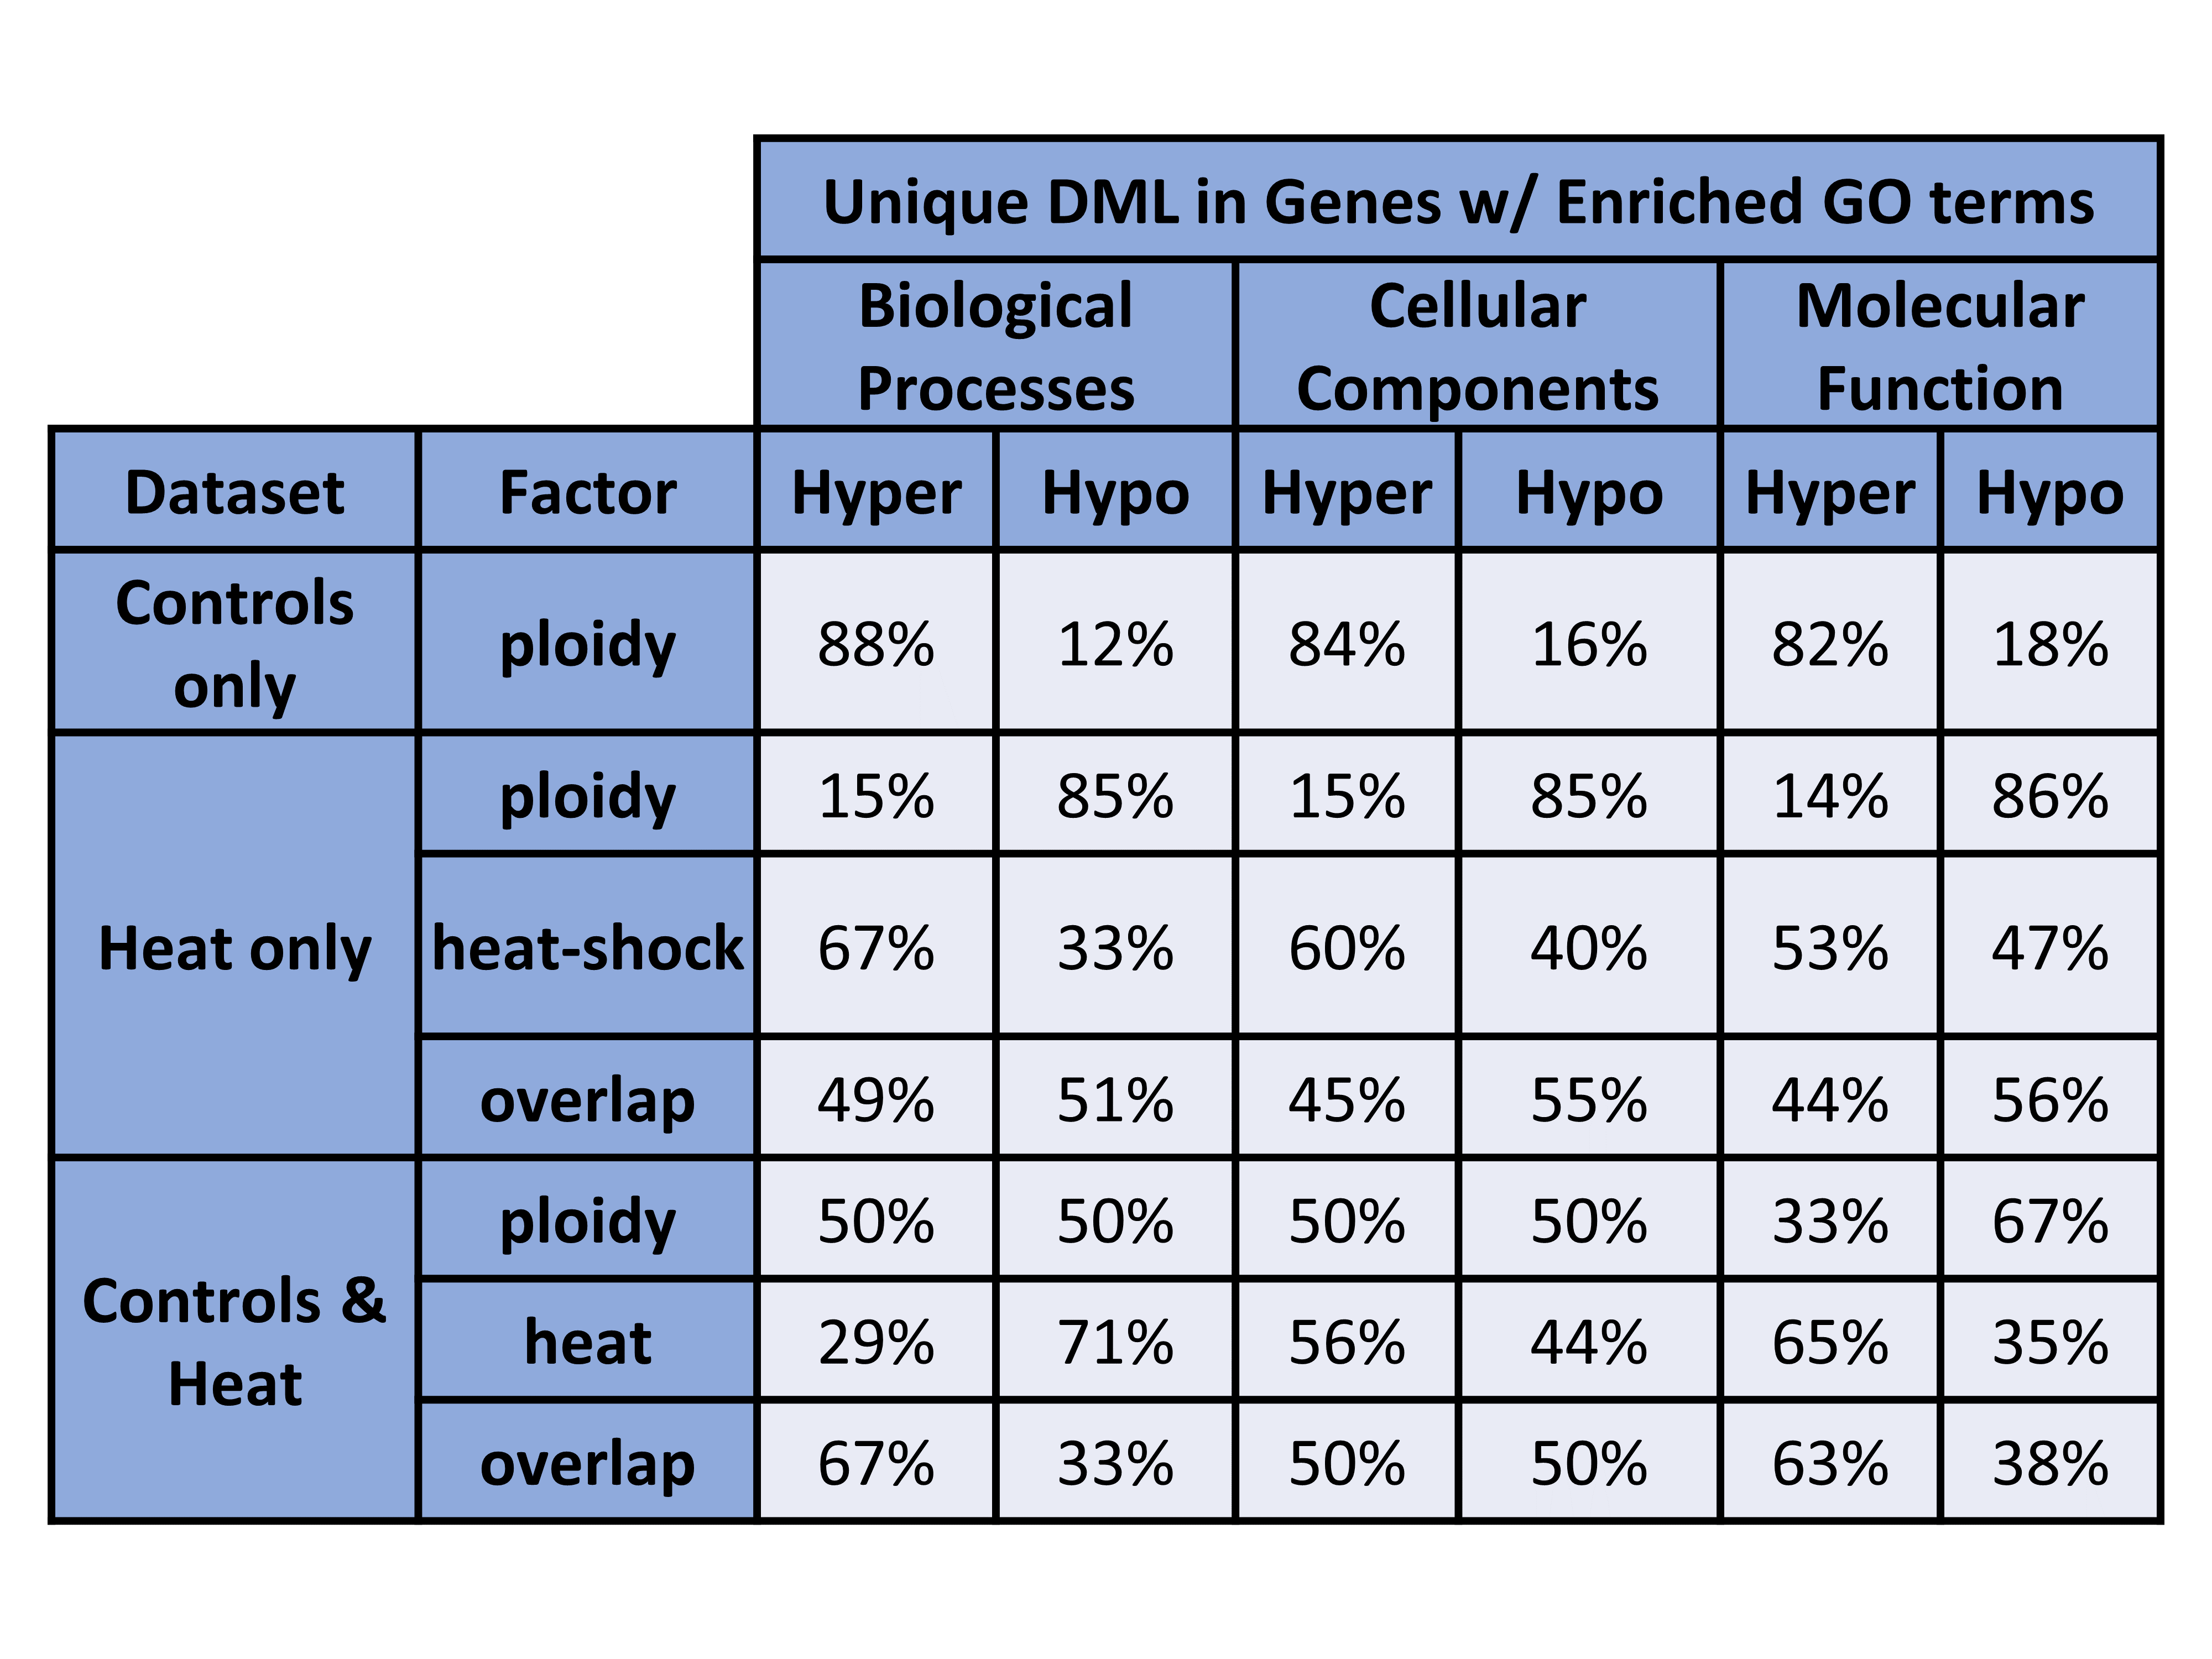
Figure 3. Unique DML in Genes w/ Enriched GO terms (counts).
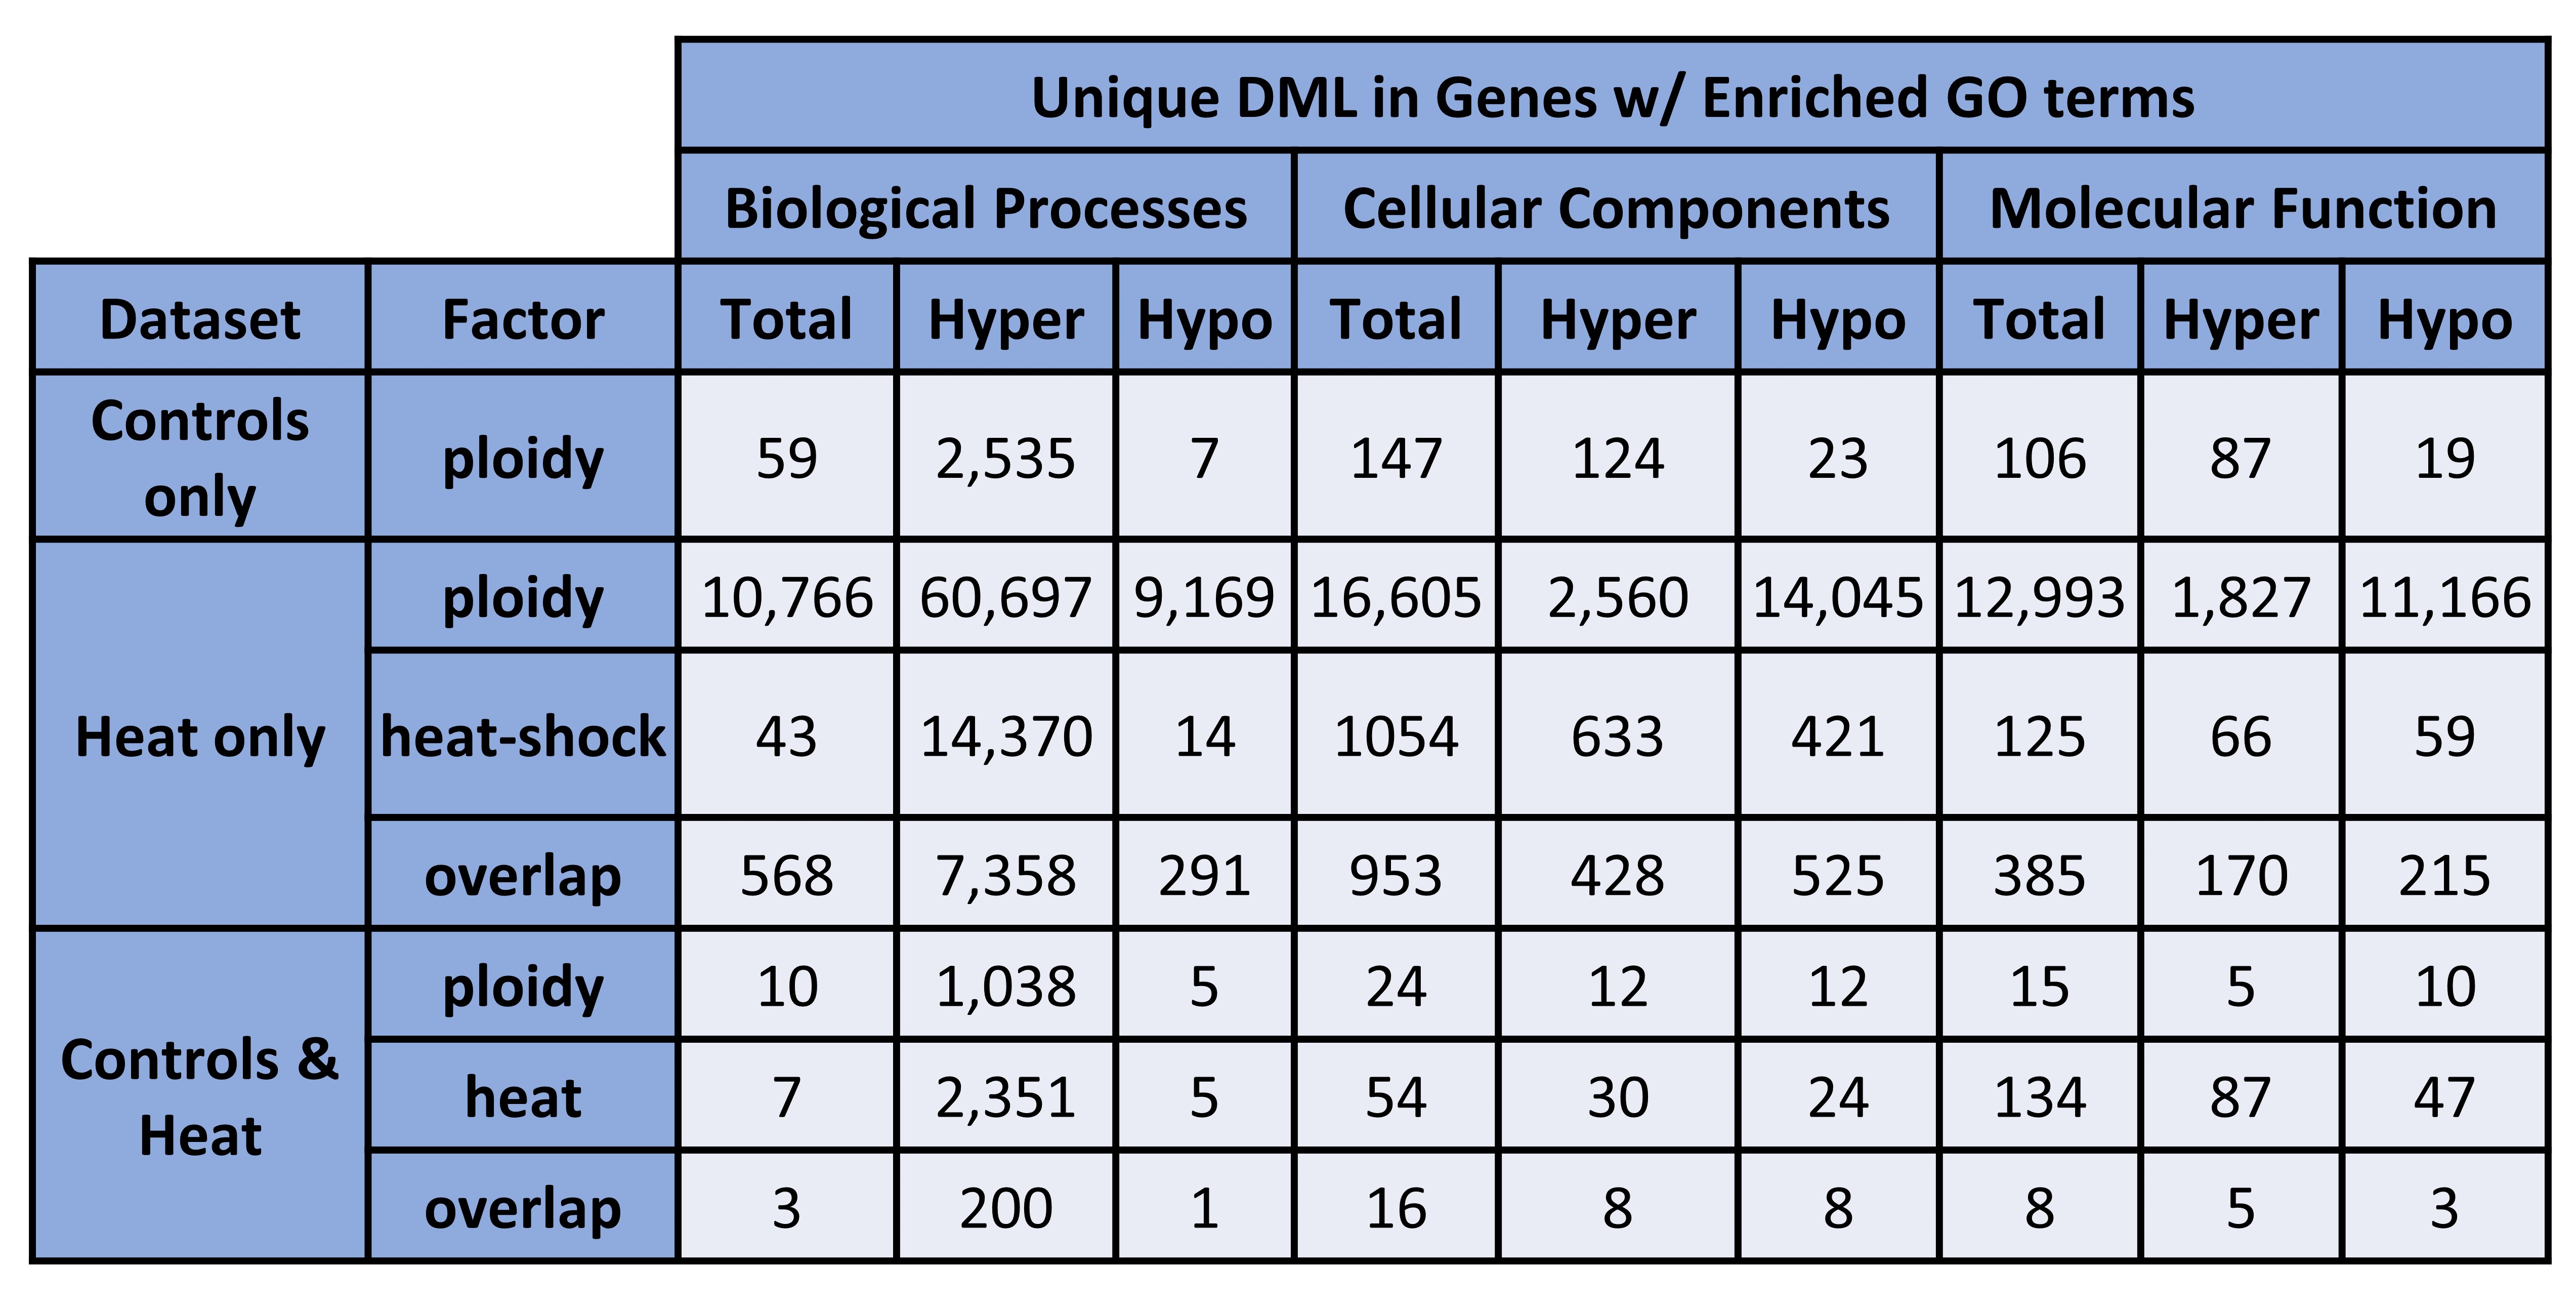
Figure 4. Unique DML in Genes w/ Enriched GO terms (percentages).