Project name: NOPP-gigas-ploidy-temp
Funding source: National Oceanographic Partnership Program
Species: Crassostrea gigas
variable: ploidy, elevated seawater temperature, desiccation
Github repo: NOPP-gigas-ploidy-temp
« previous notebook entry « | » next notebook entry »
Tagseq analysis - Generate Gene Tables
Using the following R script:
- I imported the significant (p<0.05, lfc>1.5) genes generated from DESeq2 using the apeglm shrinkage estimator for each comparison,
- sorted by whether the LOCID were characterized or uncharacterized, and
- generated gene tables w/ descriptions
Here are the results:
VOLCANO PLOTS: Multiple comparisons by treatment
| comparison | control | single-stressor | multi-stressor |
|---|---|---|---|
| ploidy |  |
 |
 |
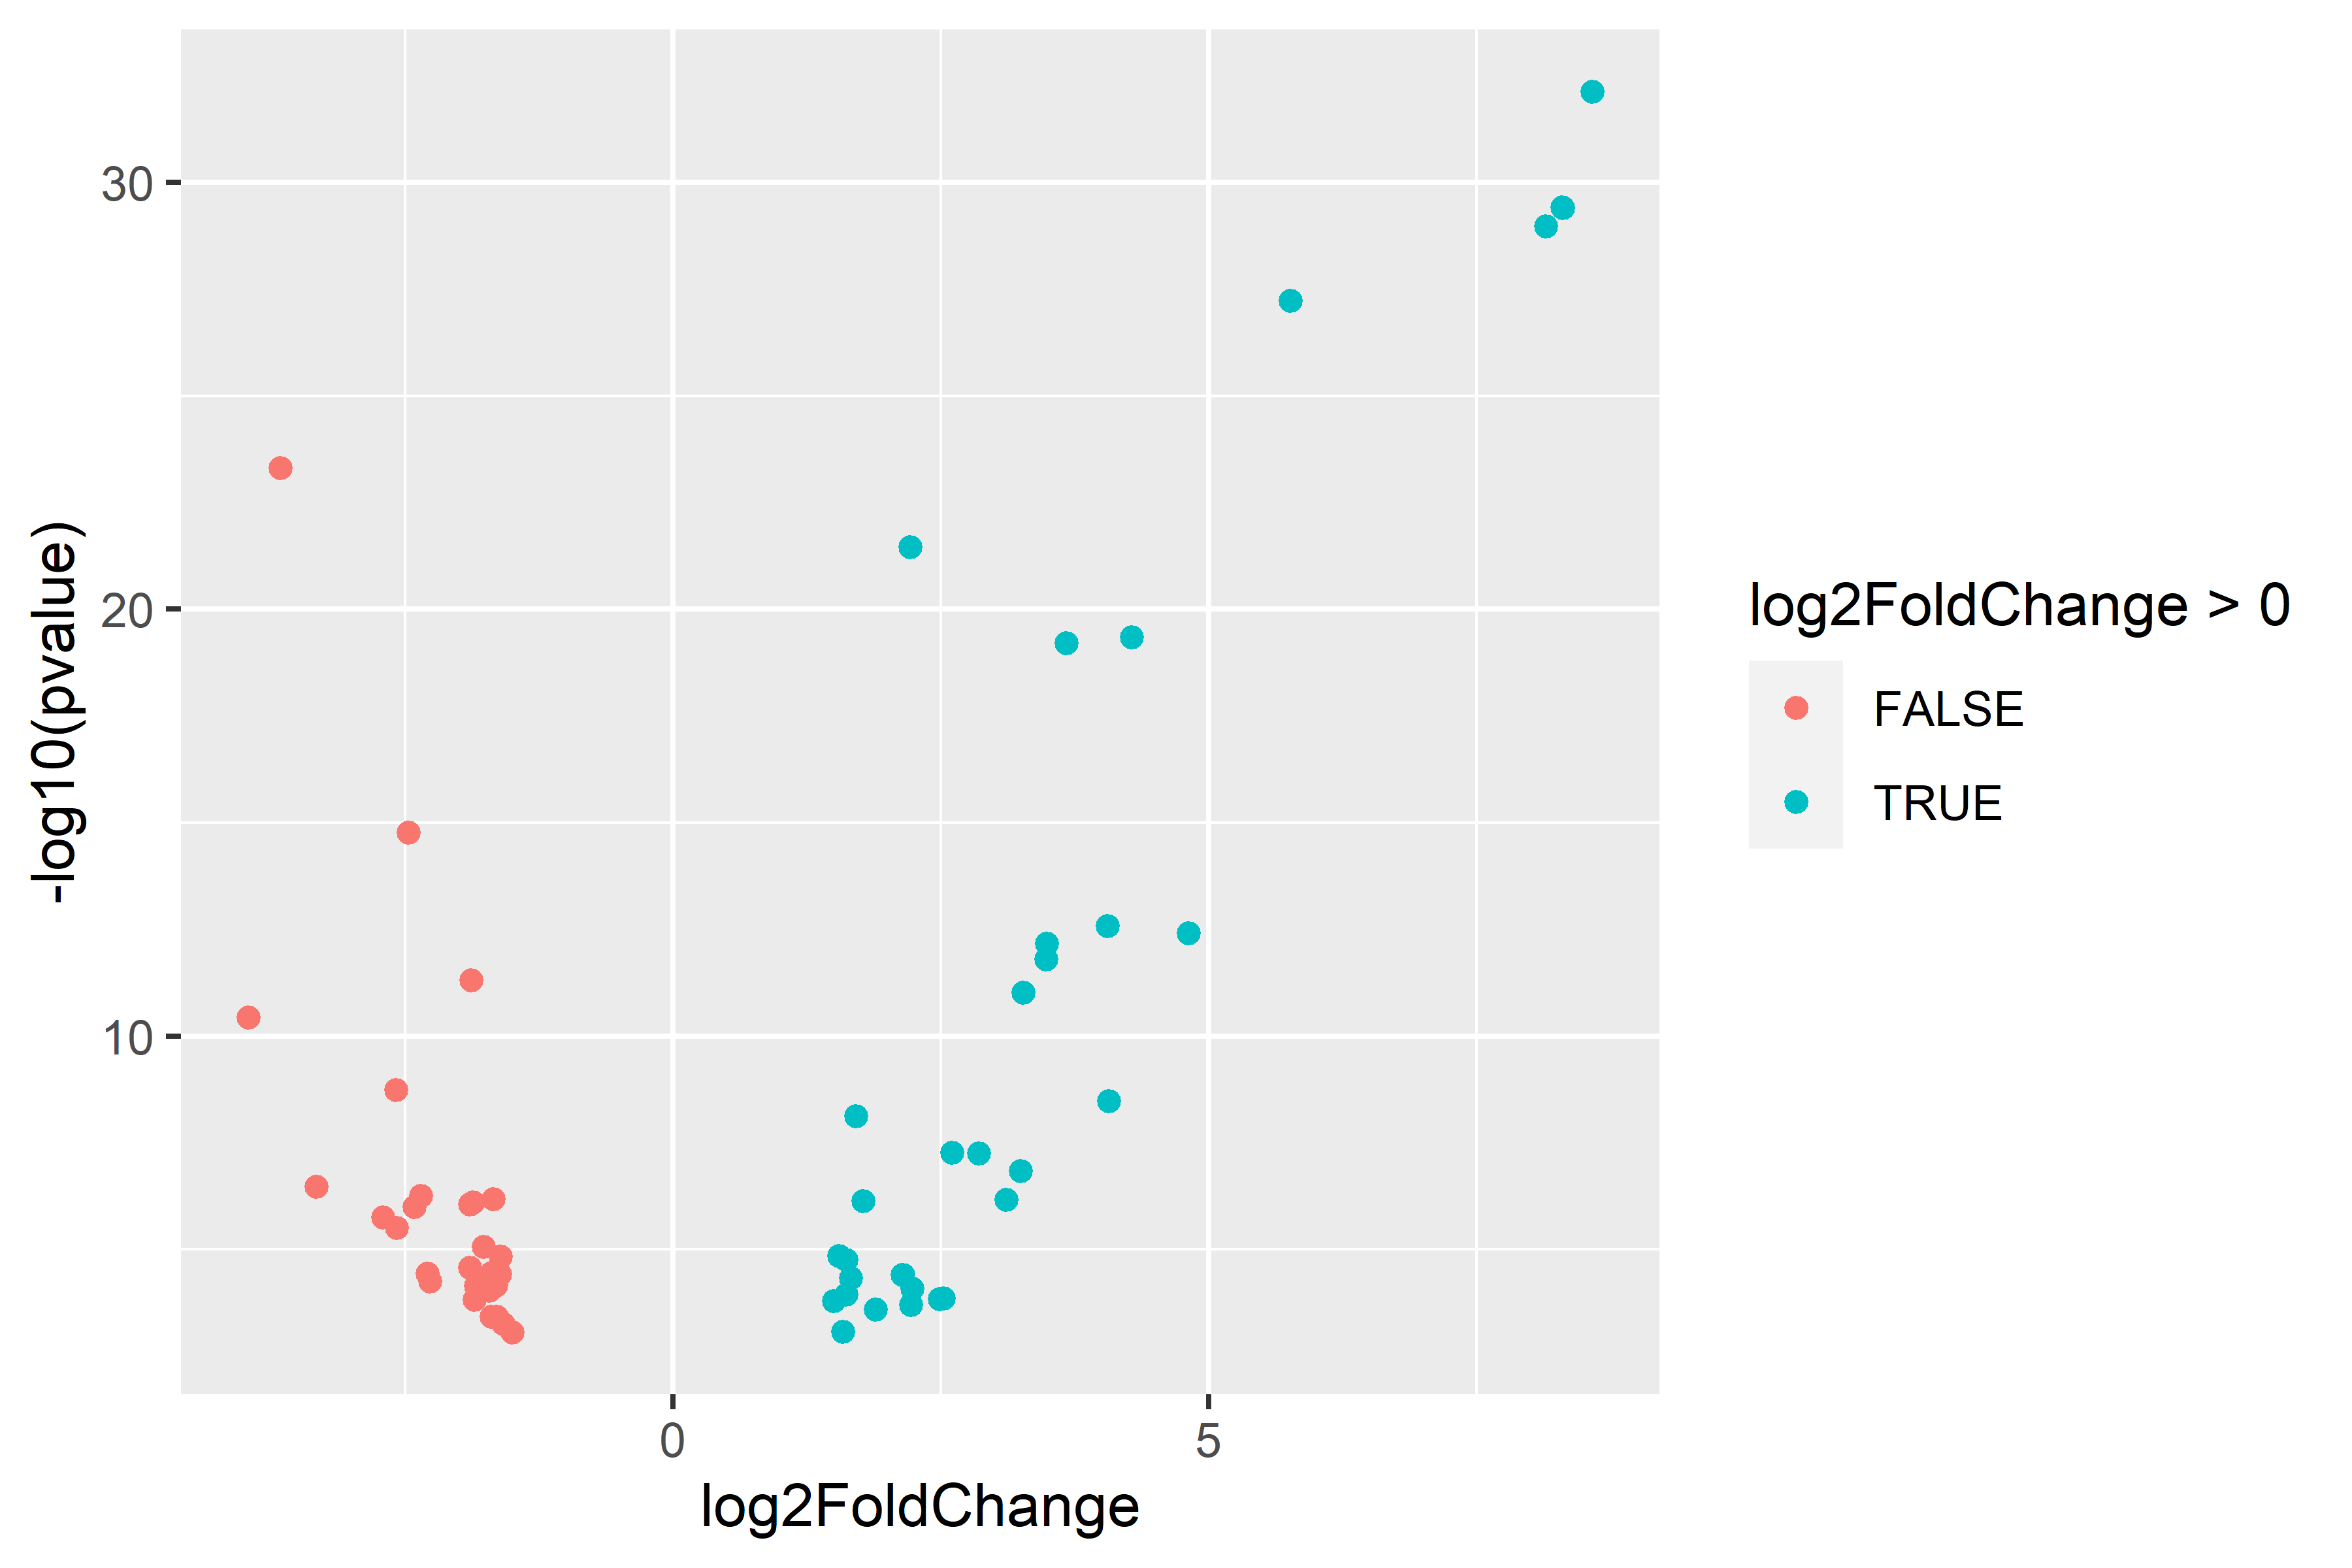
VOLCANO PLOTS: significant genes by ploidy
| comparison | diploid | triploid |
|---|---|---|
| single-stressor v control | 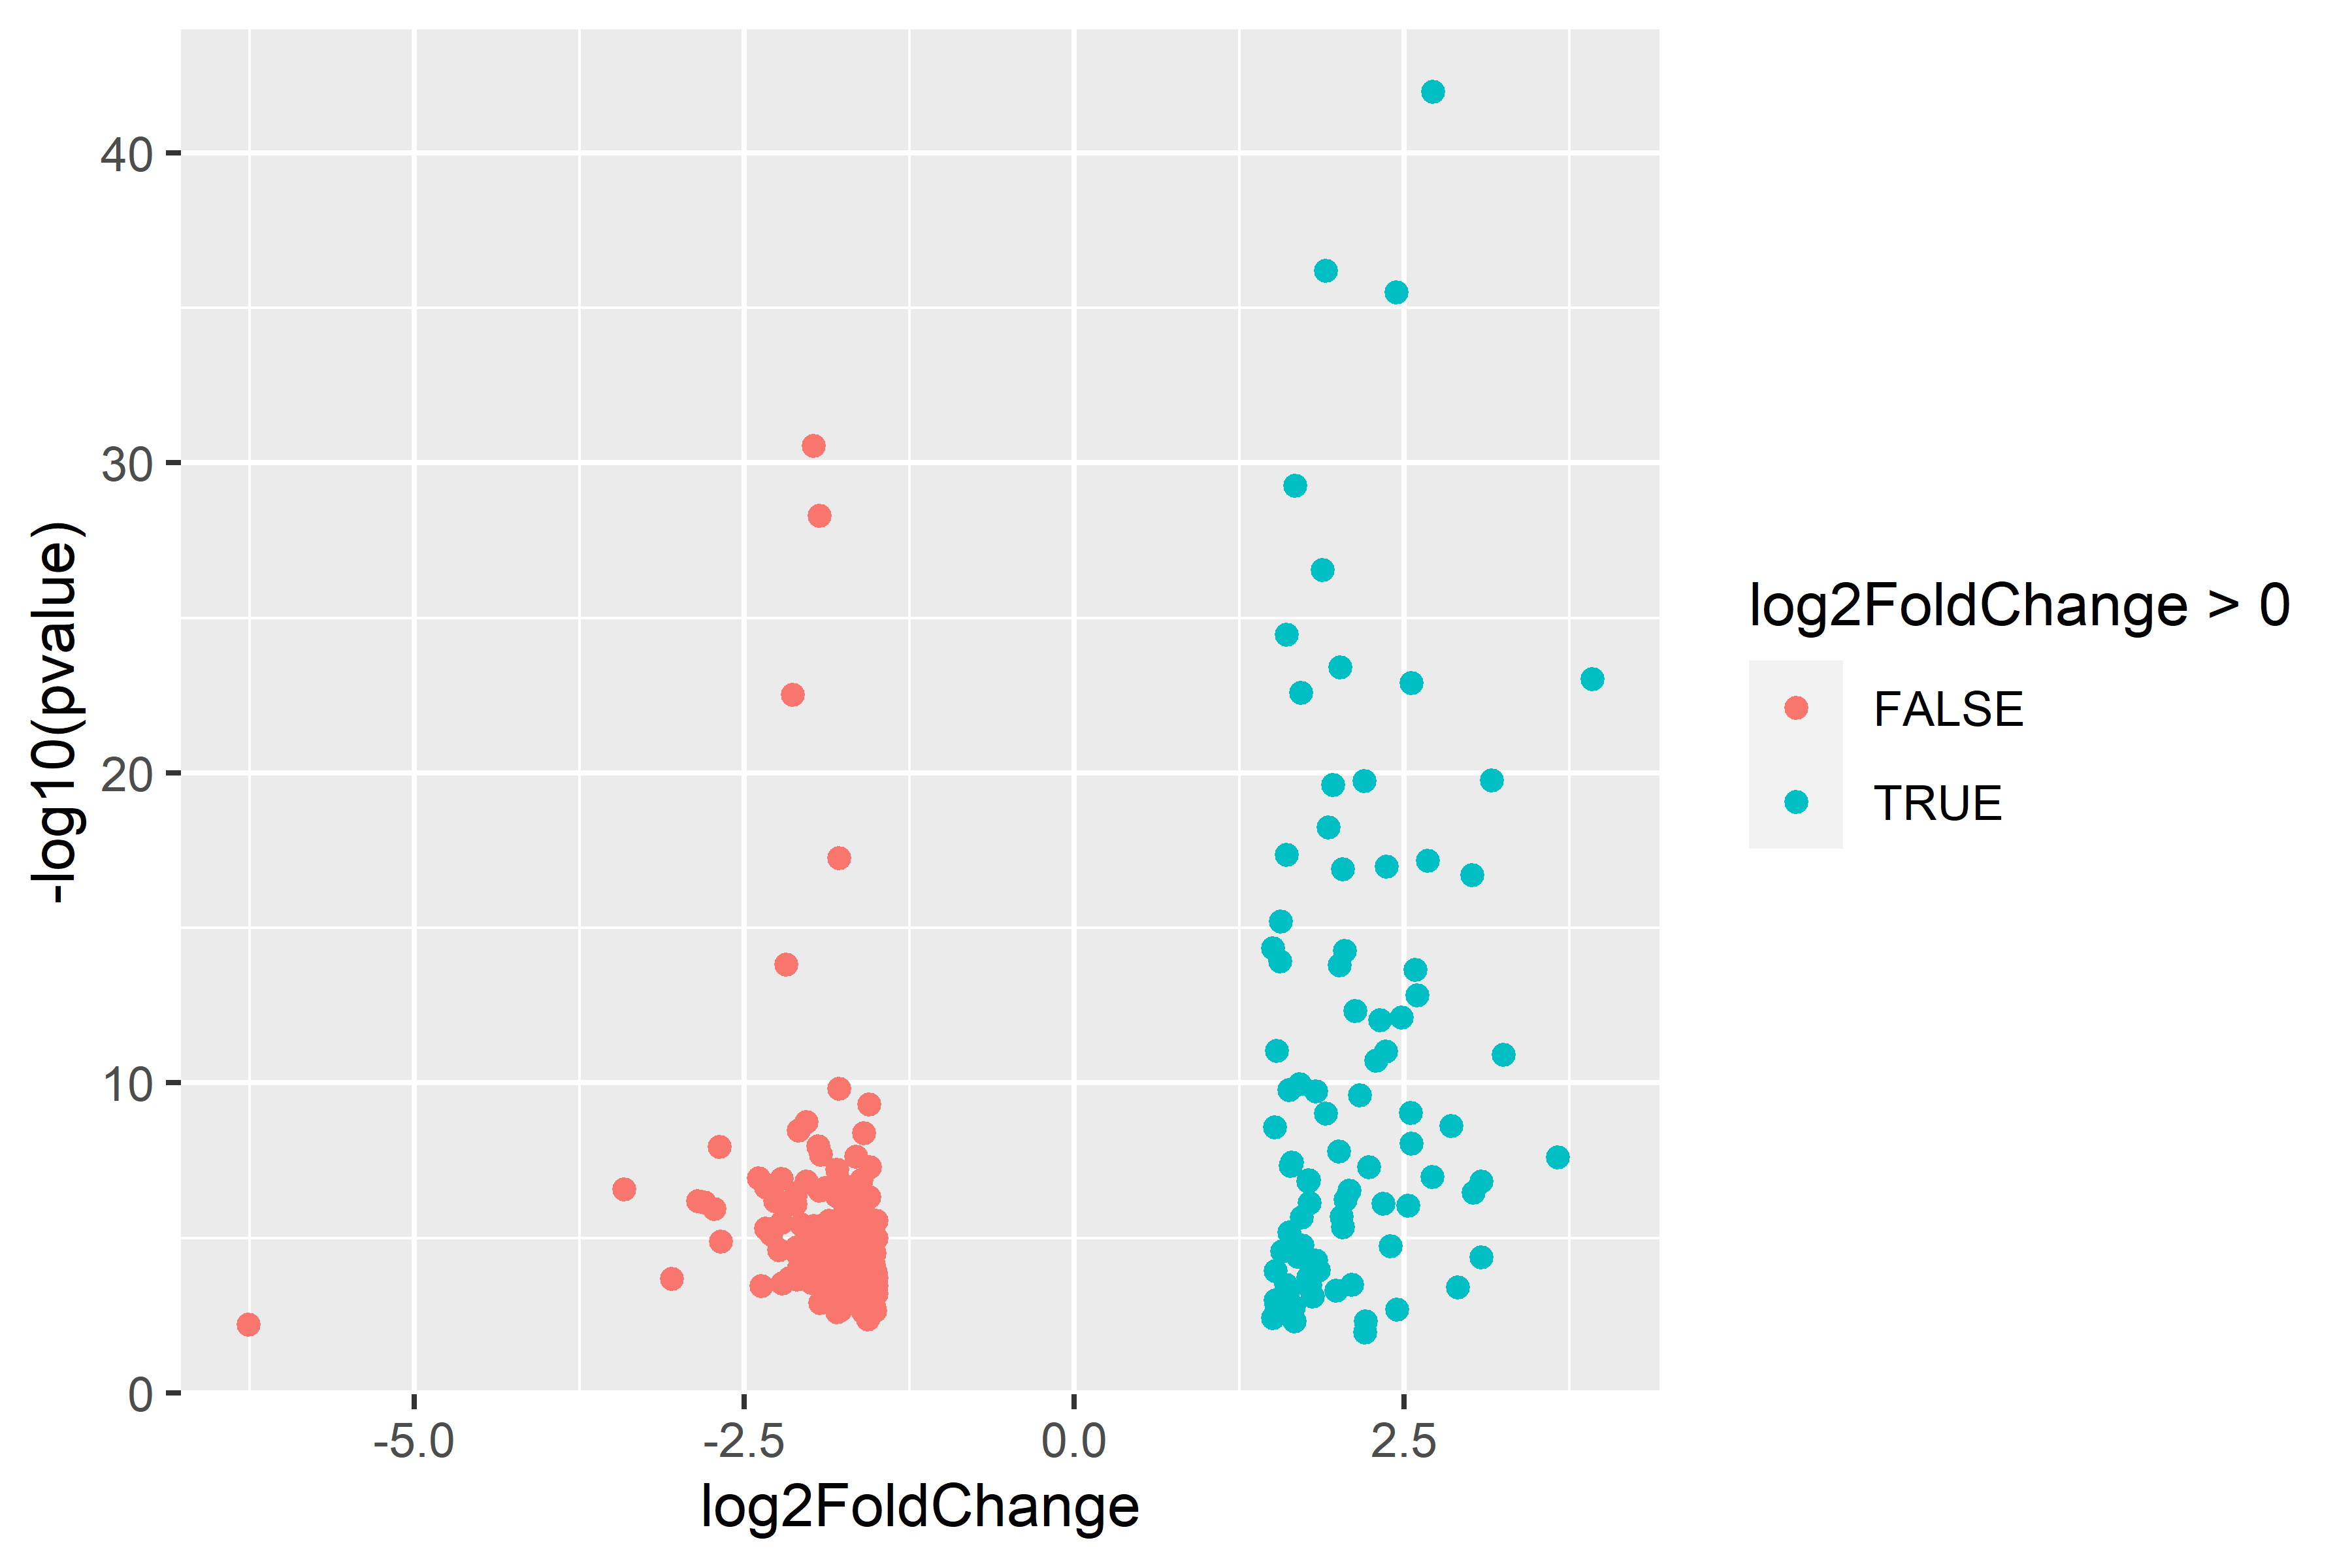 |
 |
| multi-stressor v control | |
 |
DEG LISTS: summary stats
35% - 60% of identified DEGS were uncharacterized (LOCID w/o annotation) across treatments (SS = single stressor; MS = multi-stressor)
| ploidy | treatment | total | known | unknown | percent_unknown |
|---|---|---|---|---|---|
| both | control v control | 109 | 44 | 65 | 60% |
| both | SS v SS | 343 | 182 | 161 | 46.9% |
| both | MS v MS | 138 | 60 | 78 | 56.5% |
| diploid | SS v control | 316 | 174 | 142 | 45% |
| diploid | MS v control | 72 | 45 | 27 | 37.5% |
| triploid | SS v control | 92 | 59 | 33 | 36% |
| triploid | MS v control | 62 | 40 | 22 | 35% |
Direction of log2fold change expression for DEGs.
| comparison | total | positive | negative | percent_negative | percent_positive |
|---|---|---|---|---|---|
| control_ploidy | 109 | 80 | 29 | 26.6 | 73.4 |
| SS_ploidy | 344 | 290 | 54 | 15.7 | 84.3 |
| MS_ploidy | 138 | 81 | 57 | 41.3 | 58.7 |
| diploid_SS | 317 | 90 | 227 | 71.6 | 28.4 |
| diploid_MS | 74 | 46 | 28 | 37.8 | 62.2 |
| triploid_SS | 94 | 35 | 59 | 62.8 | 37.2 |
| triploid_MS | 62 | 33 | 29 | 46.8 | 53.2 |
DEG LISTS: links to lists
Links to lists of all and significant DEGs. SS = single stressor; MS = multi-stressor.
| ploidy | treatment | DEG_all | DEG_sig |
|---|---|---|---|
| both | control v control | X | X |
| both | SS v SS | X | X |
| both | MS v MS | X | X |
| diploid | SS v control | X | X |
| diploid | MS v control | X | X |
| triploid | SS v control | X | X |
| triploid | MS v control | X | X |
DAVID: GOterm analysis